Next.js Core Web Vitals Audit: Find the Real Bottleneck
A field-first Next.js performance audit for finding the page template, asset, script or interaction that is creating a real user problem.
- 01The three Core Web Vitals
- 02Field data first, lab data second
- 03Audit by template, not by favourite URL
- 04Third-party code: every script needs an owner
- 05The fix loop
Measured on a live Ampliflow build
Dated performance evidence, with the caveat attached.
PageSpeed Insights recorded 93 for mobile performance and 99 for desktop performance on khba.org on 11 August 2026. Lighthouse results are lab measurements and can vary between runs.
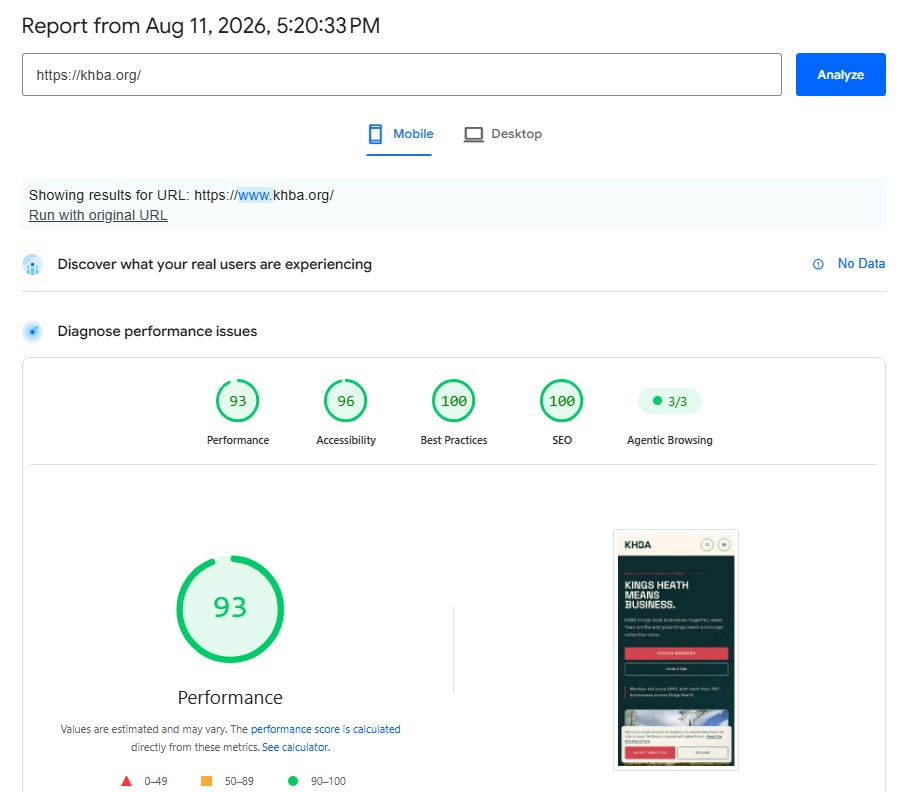
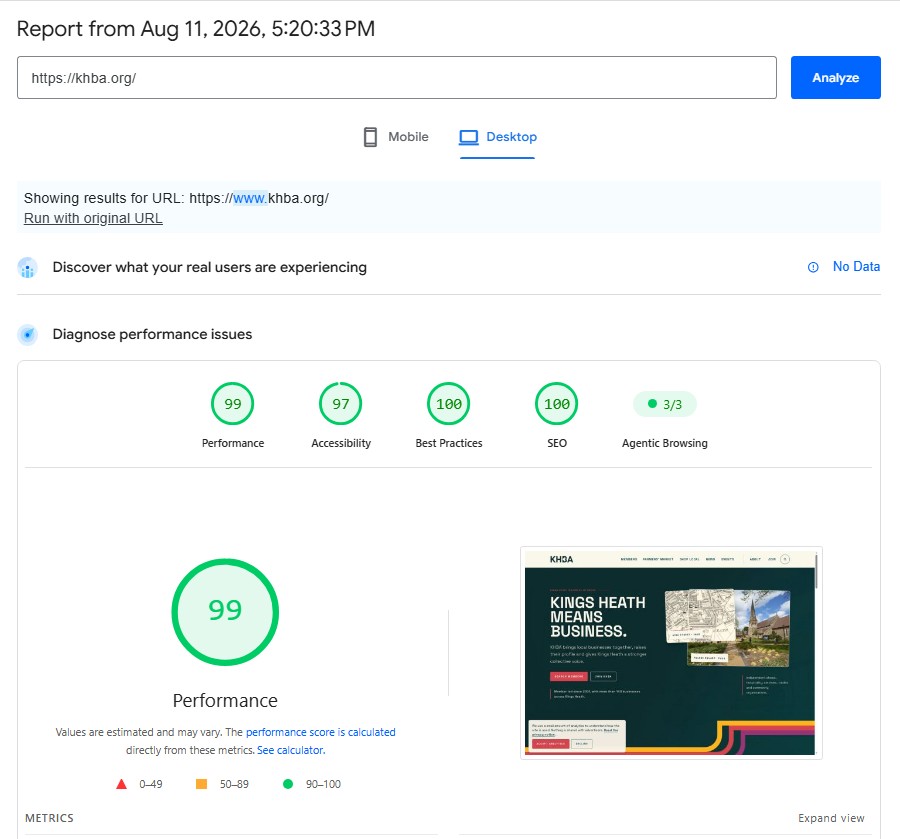
Start a Next.js performance audit with real-user data by page type. Use a lab test to reproduce the slow template, identify whether the bottleneck is the server, main image, JavaScript, fonts, layout or third-party code, then make one measured change and check the field trend again.
A score is not a diagnosis.
PageSpeed Insights can show a clean test on one page while customers struggle on a different template, device or connection. It can also show a poor lab run when the site's field data is healthy.
The useful question is not “How do we get 100?”
It is “Which real experience is slow or unstable, for whom, and what is causing it?”
Checked 26 August 2026 · Based on current web.dev and Next.js production guidance
The three Core Web Vitals
web.dev's current guidance defines three Core Web Vitals and evaluates them at the 75th percentile of page loads, separately for mobile and desktop:
| Metric | What it measures | Good threshold |
|---|---|---|
| Largest Contentful Paint (LCP) | When the largest eligible image or text block in the viewport appears | 2.5 seconds or less |
| Interaction to Next Paint (INP) | How quickly the page responds to interaction | 200 milliseconds or less |
| Cumulative Layout Shift (CLS) | How much the layout moves unexpectedly | 0.1 or less |
These thresholds describe a good user experience. They are not a promise of rankings or sales.
Field data first, lab data second
Field data
Field data comes from real visits. It includes actual phones, networks, locations, repeat visits and device constraints. Chrome User Experience Report data powers the field section in PageSpeed Insights and Search Console's Core Web Vitals report where enough eligible traffic exists.
Use it to answer:
- Which metric fails?
- Is the problem mobile, desktop or both?
- Is it site-wide or limited to one URL group?
- Did the trend change after a release, campaign or new script?
Field data uses a rolling window, so a fix will not appear instantly.
Lab data
Lab tools run a controlled simulation. Use them to reproduce and inspect the problem:
- what became the LCP element;
- which requests delayed it;
- which long tasks blocked interaction;
- which elements shifted;
- how much JavaScript and third-party code loaded;
- what happened on a cold load versus a repeat visit.
Next.js itself recommends pairing Lighthouse with field data in its production checklist.
Audit by template, not by favourite URL
Choose representative production pages:
- homepage;
- main service or category;
- long article;
- product or listing page;
- search or filter experience;
- account, portal or application route;
- highest-traffic campaign landing page.
Test the heaviest honest example in each group. A blank category and a fully populated category are different performance cases.
Record page traffic, device mix, field status, lab result, main bottleneck and owner. This prevents the audit becoming a screenshot collection.
LCP: find what delays the main content
The LCP element is often a hero image, poster, heading or large content block.
Trace four parts:
- Server response: when did the first useful HTML arrive?
- Resource discovery: did the browser find the LCP asset early?
- Download: was the file appropriately sized and cached?
- Render delay: did fonts, CSS, JavaScript or animation delay display?
Common Next.js causes include:
- a hero image loaded lazily or discovered late;
- oversized source media sent to a small screen;
- a client-side request required before the main content exists;
- a slow uncached content or product query;
- a loading animation holding back visible content;
- several web fonts competing with the main asset;
- consent, experimentation or tag scripts occupying early bandwidth.
Fix the largest proven delay. Do not preload every image or mark several resources as high priority; that only changes the competition.
INP: find the work after the click
INP measures the delay across real interactions, not just page load.
Start with the pages and components people actually use:
- navigation and mobile menus;
- search and filters;
- accordions and tabs;
- forms, validation and postcode lookup;
- product options and basket controls;
- large tables or editors;
- client dashboards.
Look for:
- a large client component re-rendering on every keystroke;
- one interaction updating much more state than necessary;
- expensive filtering or formatting on the main thread;
- third-party scripts running long tasks;
- hydration work from components that did not need to be interactive;
- event handlers that perform network, storage and rendering work before giving feedback.
The first response to a click should be visible and small. Longer work can continue after the interface acknowledges the action.
CLS: reserve space before it arrives
Layout shift usually comes from content entering a space the page did not reserve.
Check:
- images and video have dimensions or an aspect ratio;
- cookie notices and sticky bars do not push the page after load;
- fonts do not create a large text reflow;
- loading skeletons match the eventual component;
- embeds and advertisements have fixed slots;
- client-only content does not appear above what the user is reading;
- animations use transforms rather than changing layout properties.
A stable page feels faster even when the network timing is unchanged.
The JavaScript boundary
The App Router lets teams keep much of the page on the server and add client components where interaction is needed.
Audit the boundary:
- Does this component need state, effects or browser APIs?
- Can the server send the initial content?
- Is a large package loaded for one small interaction?
- Can the interactive island be smaller?
- Does the feature justify the bytes and main-thread time on mobile?
Do not remove useful interaction to improve a score. Deliver only the code the useful interaction needs.
Third-party code: every script needs an owner
Analytics, consent, chat, advertising, reviews, personalisation and video can dominate the page.
For each third party, record:
| Question | Decision |
|---|---|
| What business job does it do? | Keep, replace or remove |
| When does it need to load? | Before interaction, after consent or on demand |
| Which pages need it? | Site-wide or scoped |
| What happens if it fails? | Safe fallback |
| Who reviews its cost? | Named owner and date |
“Marketing needs it” is not an implementation plan. A measured conversion event may justify its cost; an unused dashboard usually does not.
Images and fonts: govern what editors can add
One optimised launch can become slow after six months of content updates.
Set editorial guardrails for:
- accepted image formats and maximum source size;
- intended crop and aspect ratio;
- responsive image sizes;
- hero versus below-the-fold loading;
- meaningful alternative text;
- font families, weights and character sets;
- video poster images and click-to-play behaviour.
The production system should make the correct path easier than the damaging one.
A performance budget buyers can understand
Do not set one universal bundle number without context. Set boundaries around the journey:
- main content appears promptly on a realistic mobile connection;
- important taps respond without a visible pause;
- content does not jump as media and fonts arrive;
- the main template remains within agreed field thresholds;
- new third-party code requires a named reason;
- representative pages are checked after meaningful releases.
Technical budgets can sit underneath these rules. The public promise should remain the experience.
Proof needs a date and a caveat
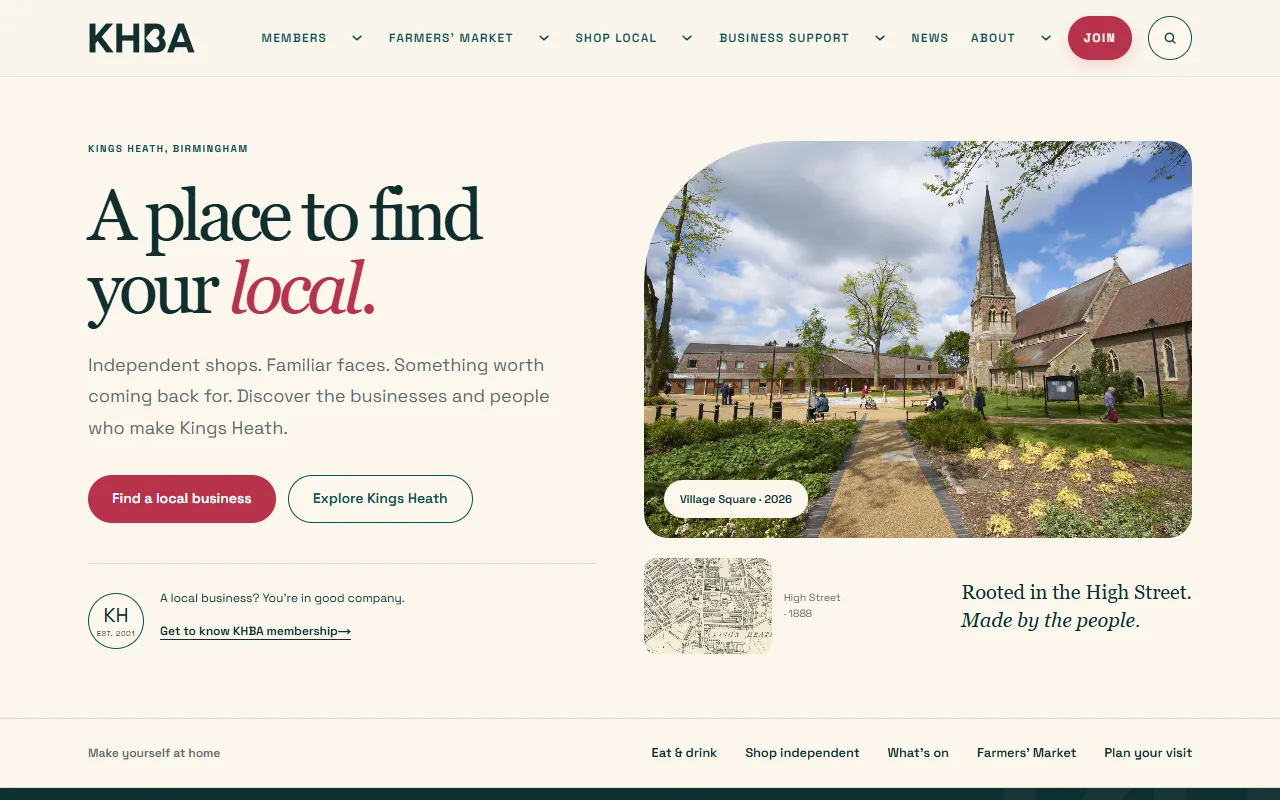
On 11 August 2026, Google PageSpeed Insights recorded performance scores of 93 mobile and 99 desktop for the live Kings Heath Business Association website. The KHBA case study shows the reports.
Those are lab measurements from that date. They can vary between runs and do not guarantee the same result for another website. They are useful because the page shows the evidence, names the method and keeps the caveat attached.
The fix loop
- 01Segment
- 02Reproduce
- 03Name the bottleneck
- 04Change one thing
- 05Recheck
- 06Watch field data
- Segment field data by device and page group.
- Pick the failing template with the greatest user or business impact.
- Reproduce it in a controlled lab run.
- Name the largest bottleneck.
- Make one focused change.
- Check for visual, functional, accessibility and analytics regressions.
- Compare the lab result and watch the field trend.
- Record the decision so the bottleneck is not reintroduced.
That loop is slower than installing a performance plugin and much faster than guessing for a month.
Performance is part of the product
A fast Next.js website is not a framework feature switched on at launch. It is the result of architecture, content, code and third-party decisions staying owned.
If you need that responsibility inside the build, see Ampliflow's UK Next.js development agency approach or US Next.js development company approach.
Related: Next.js SEO checklist · Choose a Next.js agency · WordPress to Next.js migration