The Real Cost of a Slow Website (2026): What Speed Does to Enquiries
Co-founder of Ampliflow. Builds AI automation, websites, SEO/AEO, and growth systems for UK SMEs.
A slow website can make a useful visit harder. A performance score cannot tell you how many customers you lost. To assess the commercial cost, separate the technical problem from the traffic, offer and enquiry journey around it.
Start with the page people actually land on. Check whether its main content appears promptly, whether controls respond and whether the layout stays steady. Then verify that a visitor can understand the service and successfully contact you.
Reviewed: 11 September 2026 · Performance diagnostics and a worked decision method; no claimed conversion uplift
What PageSpeed Insights measures
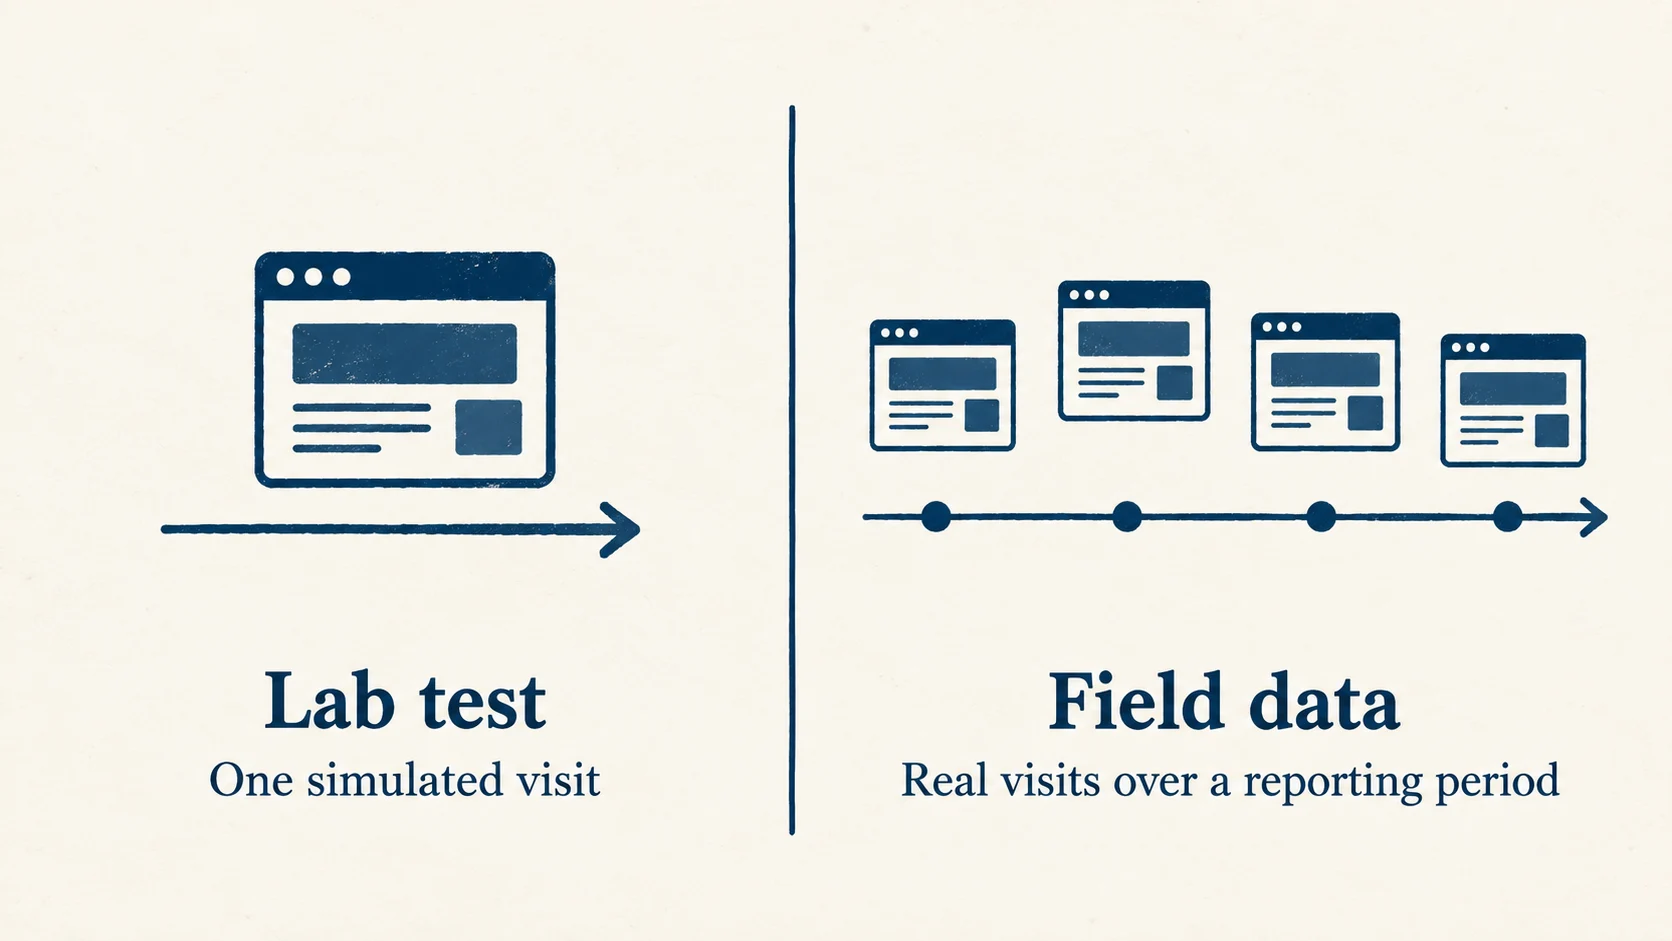
PageSpeed Insights combines a lab test with real-user field data when enough data is available. The two answer different questions. A lab run helps diagnose one simulated visit; field data describes experience across real visits over a reporting period. Read Google's explanation of the reports before treating them as interchangeable.
| Measure | What it describes | What it does not prove |
|---|---|---|
| Largest Contentful Paint, LCP | When the largest visible content element appears | That the visitor understood the offer |
| Interaction to Next Paint, INP | Responsiveness to interactions in real use | That every form submission succeeded |
| Cumulative Layout Shift, CLS | Unexpected visual movement | That the layout is otherwise accessible |
| Total Blocking Time, TBT | Blocking measured during a lab load | The same measurement as field INP |
| Lighthouse performance score | A weighted lab diagnostic | A conversion rate, ranking or number of lost leads |
Google's good Core Web Vitals thresholds are LCP at or below 2.5 seconds, INP at or below 200 milliseconds and CLS at or below 0.1, assessed at the 75th percentile of visits. See the Core Web Vitals definitions. A site can have a strong lab score without enough field data to establish a real-user pass.
Save the tested URL, date, device profile and report. An old screenshot without those details is weak evidence of today's experience.
Find the bottleneck before choosing the fix
Large images, third-party scripts, slow server responses, font loading and expensive browser work can all contribute. Do not assume the platform is responsible before examining the page.
- Test the important landing pages. The homepage may be fast while a service page or article is not.
- Identify the delayed element or interaction. Work from the report and the browser's actual behaviour.
- Check the likely cause. An oversized image needs a different fix from a slow data request or blocking script.
- Make a bounded change. Keep useful content and working features intact.
- Repeat the same diagnostic conditions. Record variation rather than selecting only the best result.
- Test the customer task again. A lighter page is not an improvement if its booking or enquiry route breaks.
A custom build can be slow. A template can perform well. Choose the fix from the evidence, then decide whether a focused project or a broader redesign is justified.
How to investigate the effect on enquiries
Compare like with like. A week with fewer enquiries might also have fewer relevant visitors, a different traffic source, a holiday or an offer change. Performance alone cannot explain the result.
Record the landing page, traffic source and device alongside genuine enquiries where your consent and measurement setup allow it. Exclude tests, spam and repeat submissions. Keep analytics limitations visible: people who decline analytics can still send an enquiry.
| Observation | Next investigation |
|---|---|
| Few relevant visitors reach the page | Search visibility, referrals and acquisition |
| Visitors arrive but cannot understand the service | Message, scope, proof and fit |
| Mobile users struggle to act | Navigation, readability, controls and performance |
| A form appears successful but nothing arrives | Submission storage, delivery and response ownership |
| Enquiries arrive but rarely become suitable work | Qualification, offer fit and follow-up |
This prevents an expensive redesign being prescribed for a delivery failure—or another traffic campaign being prescribed for a confusing page.
A worked way to assess the economics
Use this as a scenario, not a prediction. Suppose a page receives 200 relevant visits in a month and produces four genuine enquiries. That is a measured enquiry rate of 2%, assuming both counts cover the same eligible population.
If a later comparable period produces five enquiries from 200 visits, the rate is 2.5%. One additional enquiry is worth investigating, but the sample is too small to attribute the change confidently to a speed fix. Source quality, seasonality and ordinary variation may explain it.
The commercial value also depends on how many enquiries qualify, become jobs and leave money after delivery costs, before overheads and tax. Revenue per job is not profit. Estimate a range, record the assumptions and compare it with the cost of the proposed work.
For the definitions and cohort checks, use the KPI dashboard template. Do not turn a theoretical uplift into a client-result claim.
Speed, Google rankings and AI answers
Google uses Core Web Vitals in its ranking systems, but good scores do not guarantee top rankings. Its page-experience guidance makes that distinction clear.
For AI Overviews and AI Mode, pages need to be indexed and eligible for a snippet. Google says there are no additional technical requirements or special AI markup. A faster page is not evidence that ChatGPT, Gemini or another system will cite your business more often.
Make the content useful, accessible and trustworthy. Improve performance because the visitor experience matters; measure search and enquiry outcomes separately.
What to bring to a performance conversation
Bring the affected URLs, a saved report, the device or interaction causing trouble and the task visitors need to complete. Include any recent changes that might explain the problem. You do not need to diagnose it yourself.
Ampliflow's focused website projects start from £497, with the exact scope confirmed before work starts. That is not a fixed price for every performance problem. A small repair may fit; a deeper structural issue needs its own scope.
Related: small-business website design · website cost UK · redesign without losing SEO